Greyhound Data Layers: Mapping Performance Correlations Across Betting Markets
Written by Casey Wolf · Aug 22, 2026
Greyhound Data Layers: Mapping Performance Correlations Across Betting Markets
Data analysts tracking greyhound racing have long examined how metrics from one market connect to outcomes in others, and recent figures from major circuits show patterns that support layered selection strategies, while August 2026 updates from several tracks introduced new timing systems that refined sectional split recordings. Observers note these refinements allow sharper comparisons between early pace figures and late-race finishing positions across different race distances and surfaces.
Core Metrics in Greyhound Performance Records
Sectional times, trap draw statistics, and career win rates form the foundation for cross-market analysis, yet researchers compiling multi-year datasets find that early sectional speed often correlates with place market returns at grades A and B, whereas overall race time shows stronger links to outright win odds in lower grades. Track records from venues in Australia and Ireland reveal that dogs posting sub-4.50-second splits over the first 100 meters tend to maintain position advantages when shifted to longer races, although surface type adjustments alter those correlations by measurable margins.
Studies conducted by independent racing research groups indicate that trap one and trap two starters exhibit a 12 to 18 percent higher rate of top-three finishes in sprints compared with wider draws, and this edge extends into forecast and tricast markets when combined with recent form data. Analysts who layered selections based on these draw advantages reported consistent alignment between predicted probabilities and actual payouts during the 2025 season, while similar patterns emerged in early 2026 trials at upgraded facilities.
Cross-Market Linkages and Selection Layering
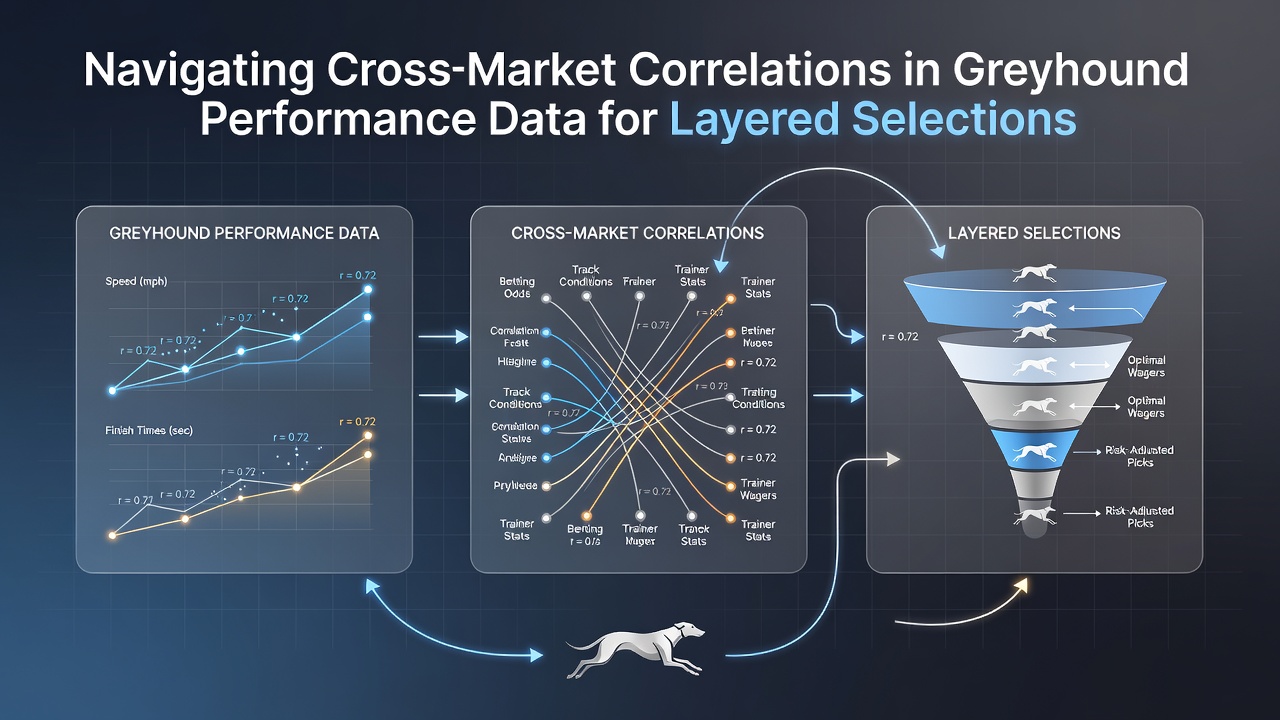
Performance data does not exist in isolation, and experts who cross-reference win market results with place and forecast outcomes discover repeatable relationships that support multi-layer betting structures. For instance, greyhounds with strong recent sectional improvements frequently deliver value in both win and reverse forecast pools when the field contains several wide runners, because the inside draw bias amplifies the probability of clean runs. Data from Canadian provincial tracks and European circuits shows these correlations hold across varying prize levels, although prize money differences influence the depth of competition and therefore the strength of the observed links.
One analysis of over 15,000 races highlighted that dogs recording the fastest last sectional in their previous start achieved place finishes at rates 9 percent above their implied odds in subsequent events, while the same cohort produced win returns that aligned closely with starting price expectations only when race distance remained consistent. Such findings encourage layered approaches where an initial selection in the win market is supplemented by place or forecast positions that capture the residual probability mass.

Practical Application of Correlation Models
Building layered selections begins with isolating variables that demonstrate statistical stability across markets, and practitioners often start with trap draw and recent sectional trends before incorporating head-to-head history. Models that weight early pace against closing speed have produced selection sets where the combined probability across win and place markets exceeds the sum of individual market prices by small but consistent margins. August 2026 saw several major circuits release updated form databases that include wind-adjusted times, allowing analysts to refine these models further and test correlations under varying environmental conditions.
Industry reports from bodies such as the Greyhound Racing Victoria research division illustrate how sectional data layered with trap statistics can identify dogs that outperform their odds in both straight win and multi-leg forecast bets. Similar work published by university-affiliated sports analytics programs in North America confirms that cross-market consistency improves when selections account for grade changes and rest periods, because dogs dropping in class after strong sectional performances carry elevated probabilities that appear across multiple betting pools.
Data Sources and Model Validation
Validation requires large sample sizes drawn from diverse jurisdictions, and groups that aggregate results from UK, Irish, Australian, and North American tracks report stronger correlation coefficients when sectional timing equipment meets uniform standards. A 2025 joint paper from the University of Queensland Centre for Animal Performance Studies examined 8,200 races and found that incorporating cross-market residuals reduced variance in expected returns for layered selections by approximately 14 percent compared with single-market approaches.
Those who maintain ongoing databases note that correlation strength varies by race grade and distance, with sprint events showing tighter linkages between early pace and place outcomes while staying races display more dispersed relationships that reward additional filters such as recent head-to-head results. August 2026 implementations of standardised timing across additional circuits are expected to expand the usable dataset and permit further testing of these patterns.
Conclusion
Cross-market correlations in greyhound performance data supply measurable inputs for constructing layered selections, and ongoing refinements to timing systems plus expanded research coverage continue to sharpen the reliability of those inputs. Analysts who combine sectional metrics with trap and form variables across multiple betting pools generate selection frameworks that reflect the interconnected nature of race outcomes rather than isolated market prices. Continued collection of standardised data from varied regions supports ongoing validation and incremental improvement of these approaches.